Need for Speed 2: Improving Front-End Performance
Last year I wrote a post, Need for Speed, where I shared my workflows and techniques along with the tools involved in the development of my site. Since then my site has gone through another redesign, and although I made various workflow and server-side improvements, I gave front-end performance extra attention. Here’s what I did, why I did it, and the tools I used to optimize front-end performance on my site.
Minimize Requests
Every asset required to render the page (external CSS or JS files, webfonts, images, etc.) as your site loads is an additional HTTP request. The average website makes 93 requests!
My goal was to minimize HTTP requests. One way is to compile or concatenate (combining/merging) CSS and JS into one file each. Automating this process (e.g. using a build tool like Grunt or Gulp) is ideal, but at the very least should be done manually for production.
Third-party scripts are common culprits for making additional requests—many make more than 1 request to grab additional files such as scripts, images or CSS. Your browser’s built-in developer tools can help you sniff out the offenders.
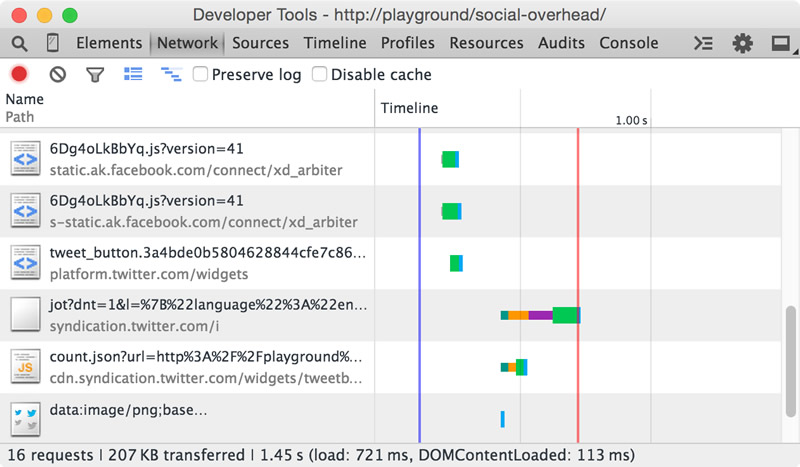
For example, Facebook’s script makes 3 requests. A test environment with social sharing scripts from a handful of popular social sites shows that they quickly add up:
| Site | Files | Size |
|---|---|---|
| Google+ | 1 | 15.1KB |
| 3 | 73.3KB | |
| 2 | 47.7KB | |
| 3 | 12.9KB | |
| Tumblr | 1 | 1.5KB |
| 4 | 52.7KB | |
| Total | 14 | 203.2KB |
Source: Responsible Social Share Links
That’s an additional 14 HTTP requests and 203.2KB. Instead, I went with “share-intent” URLs, which are basically links used to pass and construct data into a share and can be used to create social share links using just HTML. It allowed me to strip away the third-party scripts I was using for sharing, which accounted for 7 requests. I wrote more on this matter on Responsible Social Share Links.
Evaluate each third-party script and determine its importance. There may be a way to accomplish what it does without depending on the third-party. You may lose some functionality (e.g. like/tweet/share count) but ask the question: “Is the like count that important?”
Compression/Optimization
Now that I had found ways to minimize requests made, I began looking for ways to cut fat off the meat. The smaller the files, the faster they load. The average page size is 1,950KB. Here’s the content breakdown:
I used these numbers as a reference and starting point to compare and find ways to cut weight where I could. What Does My Site Cost? built by Tim Kadlec, is a wonderful tool to help you test and visualize what it costs to visit your site from around the world based on the weight of your site.
CSS and JavaScript
Compressing/minifying your stylesheets and JavaScript files can noticeably decrease file sizes—I saved up to 56% from one file in compression alone.
| Before Compression | After | Savings | |
|---|---|---|---|
| CSS | 135KB | 104KB | 23.0% |
| JS | 16KB | 7KB | 56.3% |
I write CSS using the BEM (Block, Element, Modifier) methodology, and it can result in long, verbose class names. Refactoring some of my code to be less verbose (“navigation” to “nav”, “introduction” to “intro”) gave me some savings but wasn’t nearly as noticeable as before-vs-after compression, which I expected.
| Verbose Classes | Less Verbose | Savings |
|---|---|---|
| 104KB | 97KB | 6.7% |
I also re-evaluated the need for jQuery. Of the 135KB of minified JavaScript, about 96KB was the jQuery library alone—71%! There wasn’t a lot that relied on jQuery, so I took the time to refactor my code. I shaved off 122KB by stripping away jQuery and rewriting it in vanilla JavaScript, which cut the file size down to 13KB minified.
| jQuery | Vanilla JS | Savings |
|---|---|---|
| 135KB | 13KB | 122KB (90%) |
Since then I managed to strip away even more (7KB compressed), and the script rounds out to only 0.365KB when compressed and gzipped.
Images
Images typically make up the bulk of a website. The average site has 1,249KB of images.
I ditched icon fonts and replaced them with inline SVGs . In addition, any images that could be drawn as vectors were placed with inline SVGs as well. One page of the previous version of my site was loading 145KB in icon webfonts alone, and of the hundreds of icons in the webfonts, I was only utilizing a dozen of them. In comparison, one page of the current site loads 10KB of inline SVGs—that’s a 93% difference.
SVG sprites look interesting and seem like they could be a viable solution to replacing common inline SVG icons I use throughout the site.
Use CSS instead of images when possible—there’s so much that can be done with CSS nowadays. However, browser compatibility may be an issue with modern CSS; therefore, make good use of caniuse.com and enhance progressively.
You can also squeeze bytes out of images by optimizing them. There are 2 ways to optimize images:
- Lossy—lowers image quality
- Lossless—doesn’t affect quality
For best results I do both, and the order is important. First, compress images using a lossy method, such as resizing images to sizes no bigger than necessary, then exporting them at a slightly lower quality without compromising too much (e.g. I usually export JPGs at 82–92%)
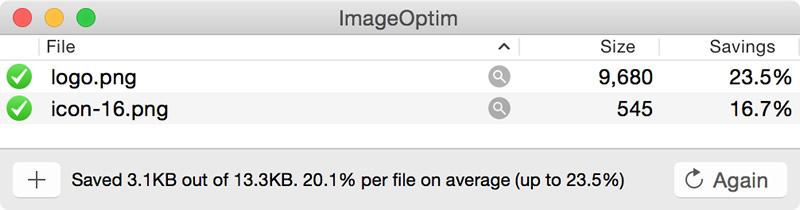
Next, run images through a lossless image optimization tool like ImageOptim, which further reduces image file sizes by removing unnecessary information such as metadata or color profiles.
Page Rendering
At this point, after all that work and sweating those details, I thought for sure my Google PageSpeed Insights scores would be in the 90s. To my demise, they weren’t.
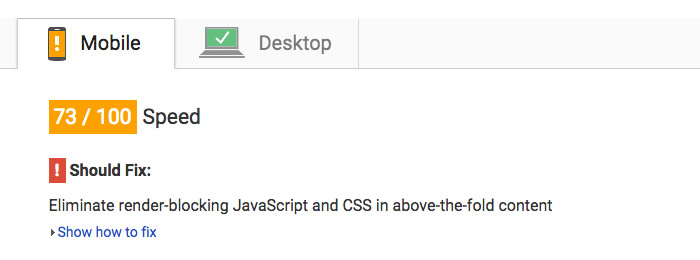
PSI scores were 73/100 on mobile while desktop score faired a bit better at 88/100. It suggested that I “eliminate render-blocking JavaScript and CSS.”
Render-blocking files increase the time it takes for the browser to display the content because the files need to first be downloaded and processed. Multiple render-blocking files require the browser to take multiple trips to fetch and process them, further increasing that wait time.
Optimizing JavaScript, CSS and webfont delivery can improve the page’s “time to first render.” To minimize that time, it’s important to understand the “critical rendering path,” which is what happens between when the first byte of the page is received and when the page is first rendered into pixels.
WebPagetest is the best tool out there to help you profile and visualize your site and pages’ performance.
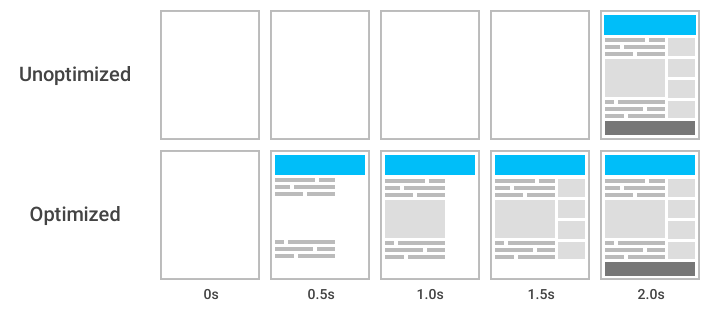
When minimizing the time to first render, we’re giving more attention to the perception of speed by rendering the content as quickly as possible, then allowing the additional presentational “stuff” to be rendered progressively as they’re processed.
CSS
Browsers, by default, treat CSS as render blocking; therefore, when it hits the pipeline, browsers hold off rendering until the CSS has been downloaded and processed. External stylesheets mean more network trips, which increase that wait time, and large stylesheets increase that time as well.
We can improve the page render time by inlining “critical CSS” in the <head> so the browser can quickly render the above-the-fold content of a page without having to wait to download the entire stylesheet, and then loading the full stylesheet in a non-rendering-blocking way.
<head>
  <style>
    /* inline critical CSS */
  </style>
</head>
Determining what CSS is or isn’t critical requires (1) viewing the page on mobile and/or desktop viewport sizes, (2) identifying the elements that are visible within that viewport, and (3) selecting the CSS that accompanies those elements.
This can be a bit tricky, especially when done manually, but fantastic tools are available to help expedite or even automate this process. I used grunt-criticalcss by Filament Group to help generate critical CSS for pages, which I then manually optimize the CSS a bit as well (merging duplicate media queries and removing CSS I deem as unnecessary).

Now that the critical CSS is inlined in the <head>, load the rest of the stylesheet asynchronously, which I do with the help of loadCSS.
<head>
  <style>
    /* inline critical CSS */
  </style>
  <script>
   // inline the loadCSS script
   function loadCSS( href, before, media, callback ){ ... }
   // then load your stylesheet
   loadCSS("/path/to/stylesheet.css");
  </script>
  <noscript>
    <link href="/path/to/stylesheet.css" rel="stylesheet">
  </noscript>
</head>
Google also gives an alternate example of loading CSS in a non-render-blocking way.
JavaScript
JavaScript can also be render-blocking; therefore its delivery should also be optimized, which can be done the following ways:
- Inlining small scripts.
- Loading external scripts at the bottom of the document.
- Deferring the execution of scripts using the
deferattribute. - Asynchronously loading possible scripts using the
asyncattribute.
<head>
  <script>
    // small inline JS
  </script>
</head>
<body>
  ...
  <script src="/path/to/independent-script.js" async>
  <script src="/path/to/parent-script.js" defer>
  <script src="/path/to/dependent-script.js" defer>
</body>
defer downloads the script as the HTML is parsed but waits to execute once the page has been rendered. defer support is pretty good; however is reported to be inconsistent and unreliable; therefore is best to both defer and have them at the bottom of the document.
async downloads the script as the HTML is parsed and executes the moment it has been downloaded. This allows for multiple scripts to be downloaded and executed concurrently; however, they’re not guaranteed to load in a specific order. Any scripts that depend on each other may need to be modified to account for these scenarios.
async support is not as great as defer, which is why I chose to use loadJS, a script for asynchronously loading JS files. It supports older browsers and also has a useful feature to conditionally load a script.
<head>
  <script>
    // small inline JS
  </script>
</head>
<body>
  ...
  <script>
    // inline loadJS
    function loadJS( src, cb ){ .. }
    // then load your JS
    loadJS("/path/to/script.js");
  </script>
  <script src="/path/to/parent-script.js" defer>
  <script src="/path/to/dependent-script.js" defer>
</body>
Webfonts
Webfonts make the content more legible and beautiful but can also have negative side effects to page rendering. When loading a page, especially on mobile connections, you may have noticed text becoming invisible for a period of time. This is known as FOIT (Flash of Invisible Text).

When a browser attempts to download a web font, it hides the text for a period of time until it finishes downloading the font and is ready to display the text. In worst case scenarios, the text becomes and stays invisible indefinitely, making the content completely unreadable.
The way I solved FOIT is by progressively loading fonts by first relying on default, system fonts (e.g. Helvetica and Georgia) to allow the content to be rendered quickly. Web fonts are then loaded asynchronously using loadCSS and rely on font events with the help of the Font Face Observer library to detect when the fonts have been downloaded. Once the fonts are downloaded and available, a class is added to the document which sets the page in the correct font.
<head>
  <style>
    body { font-family: Helvetica, Arial, sans-serif; }
    .fonts-loaded body { font-family: Roboto, Helvetica, Arial, sans-serif; }
  </style>
  <script>
    // inline loadCSS
    function loadCSS( href, before, media, callback ){ ... }
    // load webfonts
    loadCSS("//fonts.googleapis.com/css?family=Roboto:400,500,700");
    // inline FontFaceObserver
    (function(){ ... }
    // detect loading of fonts
    var roboto400 = new FontFaceObserver("Roboto", {
      weight: 400
    });
    var roboto700 = new FontFaceObserver("Roboto", {
      weight: 700
    });

    Promise.all([
      roboto400.check(),
      roboto700.check()
    ]).then(function() {
      document.documentElement.className += " fonts-loaded";
    });
  </script>
</head>
Progressively loading fonts results in FOUT (Flash of Unstyled Text) and/or FOFT (Flash of Faux Text) depending on how it’s done.

However, the benefit is that the content comes and stays available without going invisible. I wrote an in-depth post on how I defeated FOIT in Font Loading with Font Events.
Other
Additional methods, such as enabling gzipping and caching, configuring SSL, and serving assets from a Content Delivery Network (CDN) can improve front-end performance but would require some server-side finagling. For the sake of this post, I won’t get into them; however, I do want to stress that I recommend them and they will have an overall, positive impact on the performance of your site.
I will mention that because a healthy percentage of visits on my site are outside of the U.S., and my server is located in NYC, I decided to serve some of my assets onto a CDN. They’re deployed to an Amazon S3 bucket, which is tied to a CloudFront distribution.
Round Up
I’ve been making performance improvements incrementally over the course of a few months, and although it’s been a lot of work, I definitely notice a difference. I occasionally get comments about how fast my site is, and it’s a result of these performance tweaks.
I haven’t done a great job of keeping track of the metrics (especially early on), but let’s look at some comparisons with the numbers we do have.
| Average | My Site | Change | |
|---|---|---|---|
| Requests | 93 | 19 | -87.6% |
| Page size | 1950KB | 524KB | -73.1% |
| HTML | 58KB | 2.8KB | -95.1% |
| Images | 1249KB | 66.3 | -94.7% |
| CSS | 60KB | 14.6KB | -75.7% |
| JS | 303KB | 6.1KB | -98.0% |
| Fonts | 87KB | 10.2KB | -88.3% |
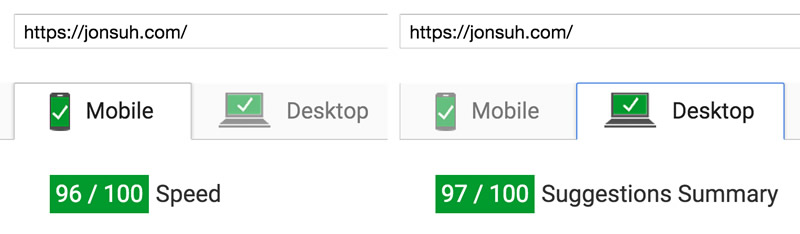
That’s an overall 87.5% better than average!—Not bad. Google PageSpeed Insights now gives my site favorable scores as well.
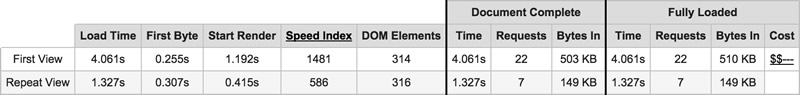
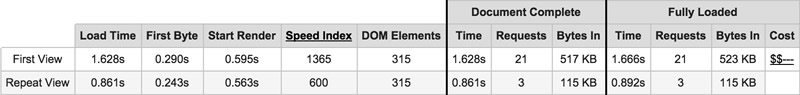
In regards to WebPagetest results, I noticed that although bytes increased on the About page, my start-render and fully-loaded times decreased considerably.
Performance improvements will always be a work-in-progress, and with HTTP/2 on its way, some of this is bound to change—techniques that used to work well may not work as well anymore, while others may become deprecated altogether.
I feel that I’ve made a lot of headway and learned a lot over the past few months. My site is open-sourced on Github, so feel free to take a peek at what’s going on under the hood. I’ve yet to figure it all out, but I hope that my sharing what I’ve done and learned with you gives you some insight. If you have any questions or wanna chat, feel free to hit me up on Twitter @jonsuh or drop me an email.
Resources
Chock full of useful resources to get you neck deep in performance.
- Google PageSpeed Insights
- SpeedCurve
- WebPagetest
- What Does My Site Cost?
- Front-end performance for web designers and front-end developers
- How we make RWD sites load fast as heck
- Improving Smashing Magazine’s Performance: A Case Study
- More Weight Doesn’t Mean More Wait
- Optimizing Performance
- RWD Bloat Part I and Part II
- Google PageSpeed Module
- Responsible Social Share Links
- Inlining critical CSS for first-time visits
- async vs defer Attributes
- Font Loading with Font Events
- Font Loading Revisited with Font Events
- Flash of Faux Text—still more on Font Loading
- The Path to Performance Podcast